Query Builder
Overview
The Query Builder allows you to build complex queries using a simple drag-and-drop interface. This article goes over the query builder features common across our core reports.
Events Menu
This is the menu that appears under "Add Metric" or "Select Step".
By default, the event menu shows all events, except for hidden events.
If you organize your events using tags in Lexicon, the tags will show up as filtering options in the event menu. When you select a tag, a list of events that share the same tag appears:

View Sample Events
You can hover over any event and in the context panel, you now have the ability to "View Sample Events", which redirects you to the Events page with the 100 most recent samples of that hovered event: You can see a few samples of an event to help you decide whether that's the right event you want for your analysis or which property you should use for filters/breakdowns.

Rename an Event within a Report
Click on the "three dots" icon beside an event and click Rename to rename it. This will only affect the current report, and will not change the event's name in other reports.
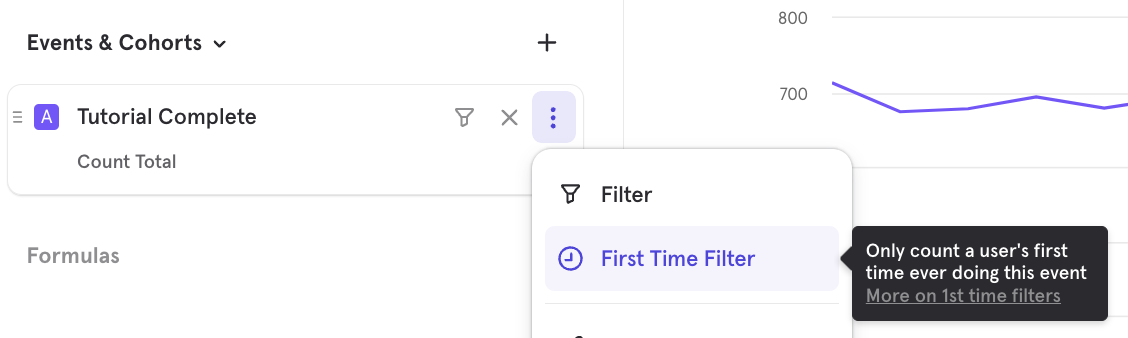
First Time Ever Filter
Sometimes, you might want to filter an event to only the first time that it's performed by a user. This helps answer the following questions:
- How many users sign up or perform another key event for the first time each week?
- Which referrers do most first time users come from?
- How quickly do users make a purchase after their first time engaging with the app?
- How well do users retain after performing a key event for the first time?
- What events do users perform before and after doing their first purchase?
You can do this by adding a First Time Filter to any event in Mixpanel. This filters the event down to only the first instance of the event in a user's entire history. (not the first time they tracked the event inside the report date range)
Mixpanel computes this on-the-fly by scanning each user's history to determine if this was the first instance of the event performed by the user, based on timestamp.
Properties Menu
This menu appears when adding a filter, an inline filter on an event or breakdown.
By default, the menu shows "all properties". This includes event properties, profile properties, group properties, lookup properties, cohorts.
You can select the following filtering options to show a subset of the properties in the menu:
-
Select "event properties" to show only the Event properties.
-
Select "user properties" to show only the Profile properties.
-
Select "cohorts" to show only the Cohorts.
-
If you set up Group Analytics, the Group keys will show up individually under their display names. You can select any Group key to show only the Group properties relevant to the selected Group key:

Understanding Prefixes in the Menu
The events and properties in the menu are prefixed to provide additional context about the properties' type. They will be removed when additional context is not needed.
-
Event properties are not prefixed (except in User report's menu:

-
User properties are prefixed by "User": "User" prefix is removed in User report's menu or once you filter the menu by "user properties".

-
Cohorts are prefixed by "In Cohort": "In Cohort" prefix is removed once you filter the menu by "cohorts".

-
Group profile properties are prefixed by the Group key display name: Group key prefix is removed once you filter the menu by a specific Group key.

-
Lookup properties are prefixed by the mapped property. Let's say "Timezone" is mapped to a Lookup Table that contains "UTC Offset" and "UTC Offset (DST)", these lookup properties will be prefixed by "Timezone"

-
Lookup properties can also be prefixed by both "User" and the mapped property to indicate that they are lookup properties of a user property

Typecasting
Mixpanel allows you to force Properties into another data type (opens in a new tab) by using the "Data Type" option in the overflow menu for property filters and breakdowns.

Typecasting is helpful when one of your properties is a number but is sent to Mixpanel as a string and you want to see histogram data for that property. Or if one of your properties is a unix timestamp and got sent as a number, and you want it to be treated as a date Property instead.
Duplicating Query Elements
To duplicate any events or properties in your query, select the inline action menu and choose Duplicate. Delete any events or properties by clicking the trash icon.
Event and Properties Indexing
The drop-down menus only show events/event properties that were ingested within the last 30 days. To select events/event properties that have not been ingested in the last 30 days, type the name of the event/event property in the Filter or Breakdown search bar. You must know the exact name of the event/event property you want to select because event names are case-sensitive.

Date and Time Selector
Determine the time range of a query by clicking on the date range selector. The date range selector is common across all reports.
All dates and times in Mixpanel reflect the project timezone. The default on most reports is “Last 30 days” (displayed as "30D"), but there are a variety of pre-set options, as well as the option to select a custom date range.

For these date ranges, the output shows results from the last complete 30 days, plus any results from the current incomplete day.
| Preset | Description |
|---|---|
| Today | Includes the current incomplete day up to the current second. |
| Yesterday | Includes the whole of the previous day from midnight to midnight. |
| Last 7 days | Last 7 days and the query count from the current incomplete day up to the current second. |
| Last 30 days | Last 30 days and the query count from the current incomplete day up to the current second. |
| Last 3 months | Last 3 months and the query count from the current incomplete day up to the current second. |
| Last 6 months | Last 6 months and the query count from the current incomplete day up to the current second. |
| Last 12 months | Last 12 months and the query count from the current incomplete day up to the current second. |
| Week to Date | From midnight of the start of the current week up to the current second. |
| Month to Date | From midnight of the start of the current month up to the current second. |
| Quarter to Date | From midnight of the start of the current quarter up to the current second. |
| Year to Date | From midnight of the start of the current year up to the current second. |
Select a Date Range
Selecting Custom on the date range selector opens up some additional options, "Last", "Fixed" and "Since".
Last
“In the last” allows you to select a rolling time range similar to the default “last 30 days” but you have the flexibility to choose the time value and scale, either days, weeks, or months.

If you need to, you can click on the + Ending button and shift back the desired time window by a selected amount of days. So for instance in the example below, we are still looking at a 2-week window that is shifted by 7 days back. This is a rolling date range and if this report is saved as a bookmark or added to a dashboard the actual dates will continue to update to show this relative time period vs. Today.

Fixed
“Fixed” allows you to select two dates to query between or a select particular day to query by entering the same start & end date. If you save this report as a bookmark or add it to the dashboard, the date range selection will always persist.

Since
“Since” allows you to select a specific date to query for all data since that start date.
To Date
"To Date" allows you select a date rnge that will update dynamically to fit the current internval. You can choose Week to Date, Month to Date, Quarter to Date and Year to Date. When the boundary of interval is passed, the date range will automatically update to include only the current interval. For example, if "Month to Date" was selected, and the date was February 27, the date range would include Feb 1 - Feb 27. The next week, after the month boundary has passed the date range would include Mar 1 - Mar 4. To Date respects start of week and start of quarter settings under project settings.
Line Chart Time Selector
Line Chart Intervals You can also choose how Mixpanel buckets the time range in Insights, Funnel Trends and Retention Trend reports (granularity may vary). To view a range in hours, you can select Hour as the view:
Line Chart Zoom To zoom in, click on the graph and drag to highlight a specific window of time in your report. Click Reset zoom to return to the previous view.
Comparisons
Comparisons allow you to compare metrics, or broken down segments of metrics against each other. Depending on the type of comparison type, you are also able see the lift of a segment or metric against another.
Time Period Comparison
Compare to past allows for comparing a metric against itself on a different time period. You are able to compare against the previous day, week, month, quarter and year. You are also able choose a custom time comparison window.
Note that if a data point for a previous year falls on a weekend, the data point is automatically moved to the next Monday to give a clearer picture of the data change from one year to the next.
Hover over a segment to see the details on the time-period selected.

By default, Mixpanel will visualize the values for both time periods. If you wish to see the lift of the current time period against the past time period, you can select the "Percent Change over Baseline" option to see the lift of your metric over time.

Value Comparison
Compare to segment allows you to set a property value as a baseline and see how every other property compares.

Compare to overall allows you compare each segment value and see what proportion it makes of the overall value.

Undo and Redo
The undo/redo keyboard shortcuts allow for fast adjustments to your analysis. Cmd + Z to undo; Cmd + Shift + Z to redo. Change filters, date ranges, line vs bar chart, and go back in one second to compare before and after, or fix the view.

- Navigate different report versions: add a new event, filter or breakdown and undo that change with
Cmd + Z. This makes iterating between different versions of your report quick and easy. - Compare visualizations: go from a bar chart, to a line chart, to a pie chart and all the way back while only using the undo / redo keyboard shortcuts.
Was this page useful?